Letzte Aktualisierung am 30. January 2024 von Dr. Michael Zechmann-Khreis
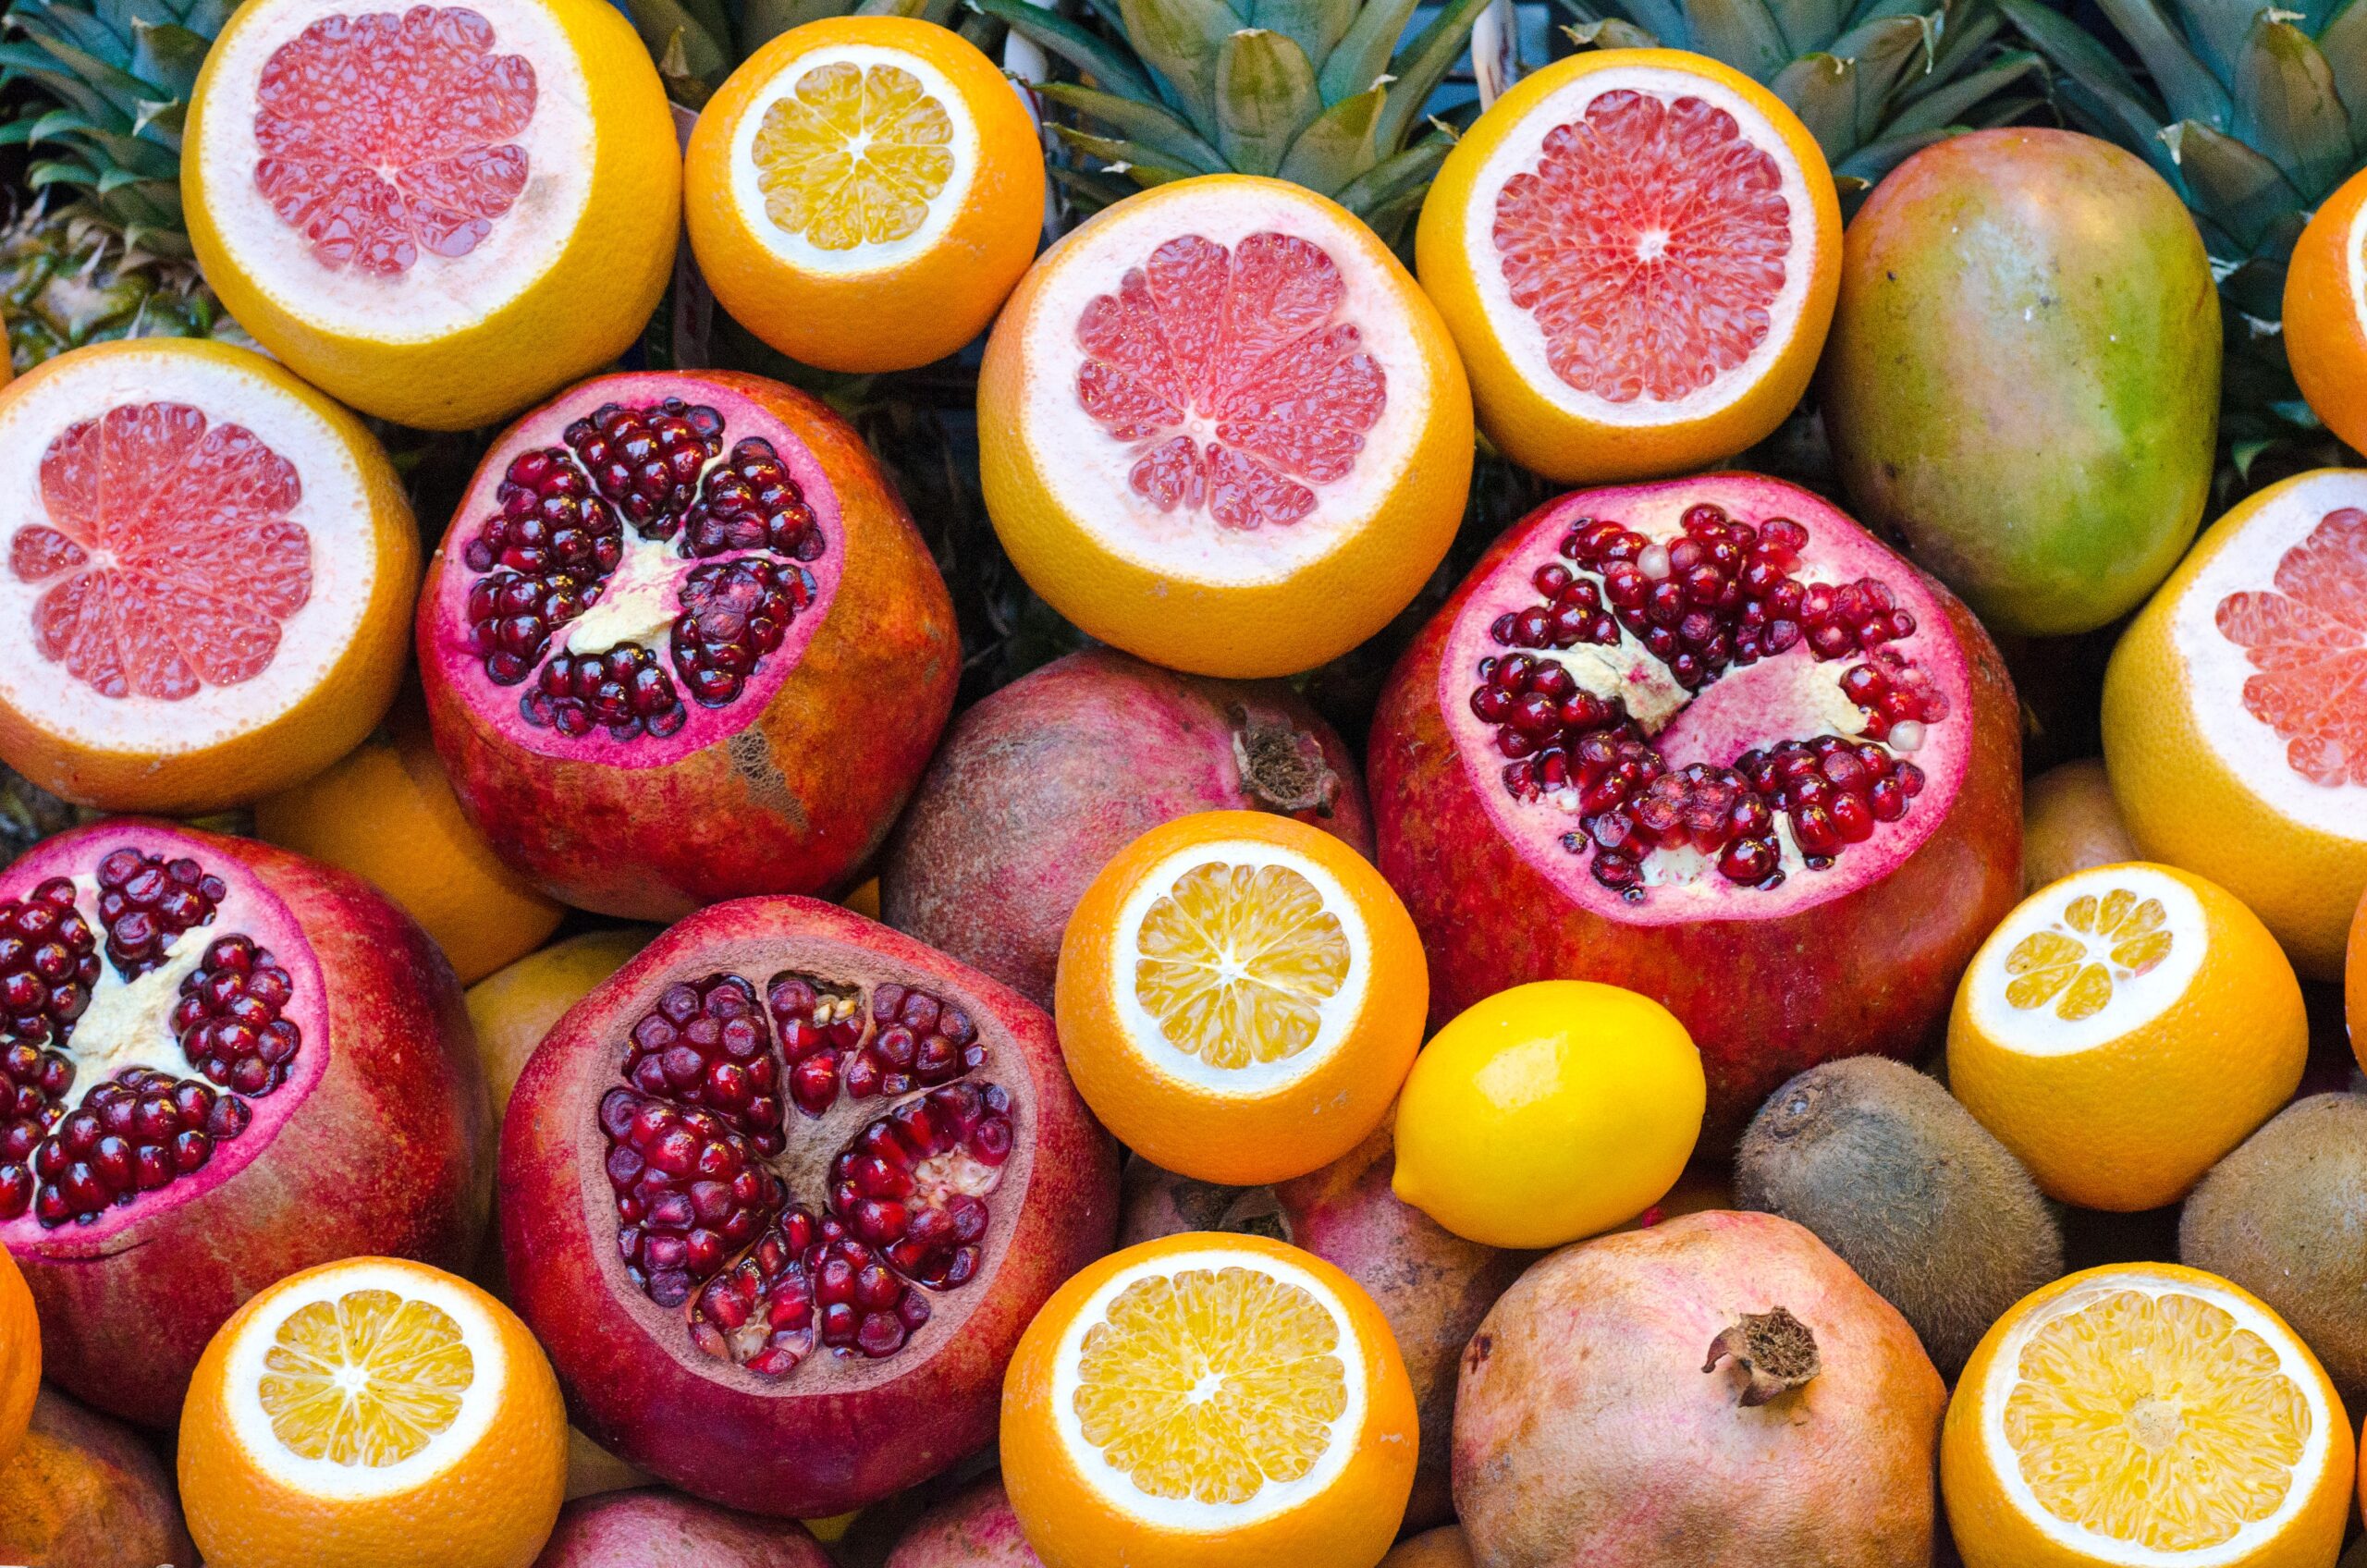
How much fructose is in my food? Can I even eat that? These two questions are sometimes very difficult to answer in the case of fructose intolerance. The sugar content of foods, and therefore also the fructose content, can vary greatly. Exact details are therefore not useful. Read here which fructose tables are good and which tools are available to help you master your everyday life despite fructose intolerance.
Table of contents
Ingredients may vary
Depending on the variety, location or harvest time, the fructose and glucose content of an apple of the same variety, for example, can vary greatly. Therefore, you have to be careful with tables and lists with fructose contents. These values are always only average values, they are never exact figures. Tables and lists such as the one below are for your guidance and should not be regarded as exact specifications. It makes much more sense to rate foods according to compatibility and label them with a traffic light system. However, this is time-consuming and difficult.
Traffic light system instead of grams in tables better
Our table with fructose and glucose values and consumption recommendations is therefore based on many years of our own research, hundreds of thoroughly researched studies and the experience of hundreds of thousands of sufferers. This makes our data the best available in the world. You can access this data by installing the “Ask Ingrid!” app.
The advantage of the app is that you can set filters, specify your intolerances and then see in the community rating how other people with your intolerance combination have tolerated the food in question. There are now hundreds of thousands of ratings, which means that the food is rated extremely well and meaningfully. Just try it out:
Fructose tolerance index
As various factors such as degree of ripeness, storage, amount consumed, variety, etc. are decisive for tolerance, we have created a tolerance index that rates individual foods in terms of their average tolerance for fructose intolerance. Not only are the above factors included in this index, but over 800 affected people were also surveyed in a separate study. The index is broken down into pictograms and displayed as a smiley. This index is unique and is based on years of research.
The table for fructose
KP=elimination diet | DE = permanent diet
FRU=Fructose, fructose | GLU=Glucose, “dextrose” | The smileys include sorbitol and other tolerance factors!
Hundreds of hours of work have gone into this table, which is protected by copyright. Private printing is permitted, commercial use or distribution is prohibited. Thank you for your respect for our work.
Please note: The table is no longer maintained, as our data is collected and better displayed in the “Ask Ingrid” app.
Product | KP | EN | FRU | GLU | F/G |
---|---|---|---|---|---|
Acerola cherry | 1,9 | 1,6 | 1,2 | ||
Agave syrup (average) | 55,6 | 12,4 | 4,5 | ||
Maple syrup (average) | 29,8 | 30,1 | 1 | ||
Alfalfa | 0,1 | 0,1 | 1,8 | ||
Amaranth | 0,8 | 0,8 | 1 | ||
Pineapple | 5,1 | 4,7 | 1,1 | ||
Apple (average) | 6,9 | 3,4 | 2 | ||
Apple cider vinegar | 0 | 0 | – | ||
Apricot (apricot) | 3,5 | 4,5 | 0,8 | ||
Apricot, dried | 16,4 | 37 | 0,4 | ||
Artichoke | 1,7 | 0,8 | 2,3 | ||
Eggplant (Melanzani) | 1,2 | 1,2 | 1 | ||
Oysters | 0 | 0 | – | ||
Oyster mushroom | 0,1 | 0,1 | 1 | ||
Avocado | 0,2 | 0,3 | 0,5 | ||
Balsamic vinegar (average) | 7,4 | 7,6 | 1 | ||
Bamboo shoots | 0,5 | 0,5 | 1,1 | ||
Banana | 7,2 | 7,4 | 1 | ||
Wild garlic | 1,5 | 1,4 | 1,1 | ||
Basil, fresh | – | 0 | 0 | ||
Leg ham (average) | 0 | 0 | – | ||
Märzen beer (average) | 0 | 0 | 2 | ||
Pear (average) | 7,2 | 2,8 | 2,6 | ||
Red cabbage | 1,5 | 1,9 | 0,8 | ||
Cauliflower | 0,9 | 1 | 0,9 | ||
Beans (from the tin, average) | 1,2 | 1 | 1,2 | ||
Brazilian guava | 4,4 | 3,8 | 1,2 | ||
Brie | 0 | 0 | – | ||
Broccoli | 1,1 | 0,7 | 1,7 | ||
Blackberry | 3,2 | 3,1 | 1 | ||
Watercress | 0,5 | 0,1 | 5 | ||
Buckwheat | 0,2 | 0,2 | 1 | ||
Butter | 0 | 0 | – | ||
Buttermilk | – | – | – | ||
Camembert | – | – | – | ||
Cashew, raw | 2,9 | 3 | 1 | ||
Champagne | 0 | 0 | – | ||
Mushroom | 0,3 | 0,3 | 1 | ||
Cheddar | 0 | 0 | – | ||
Cherimoya | 6,6 | 6,3 | 1,1 | ||
Chester cheese | 0 | 0,3 | 0 | ||
Chia seeds (average) | – | – | – | ||
Chicory | 0,9 | 1,5 | 0,6 | ||
Chinese cabbage | 0,6 | 0,7 | 0,8 | ||
Cola (average) | 5 | 5 | 1 | ||
Cola light (average) | 0 | 0 | – | ||
Cranberry | 0,7 | 3,3 | 0,2 | ||
Cranberry mother juice / direct juice | – | – | |||
Date | 31 | 34 | 0,9 | ||
Date, dried | 31,7 | 31,8 | 1 | ||
Dessert wine, sweet (average) | 2,5 | 2,6 | 1 | ||
Spelt, grain | 0,5 | 1,1 | 0,5 | ||
Cod | 0 | 0 | – | ||
Edam cheese | 0 | 0 | – | ||
Egg yolk | 0 | 0,2 | 0,2 | ||
Iceberg lettuce | 1 | 0,9 | 1,1 | ||
Protein | 0 | 0,4 | 0,1 | ||
Emmental cheese | 0 | 0 | – | ||
Energy drink with sugar (average) | 0 | 0 | – | ||
Sugar-free energy drink (average) | 0 | 0 | – | ||
Peas (average) | 3,1 | 3,1 | 1 | ||
Strawberry | 2,9 | 2,7 | 1 | ||
Peanuts | 1,3 | 1,3 | 1 | ||
Gherkin (average) | 0 | 0 | – | ||
Sweet chestnuts | 5,7 | 5,7 | 1 | ||
Fig | 5,9 | 7,2 | 0,8 | ||
Fig, dried | 26,5 | 28,7 | 0,9 | ||
Lamb’s lettuce | 0,3 | 0,5 | 0,6 | ||
Fennel | 1,3 | 1,5 | 0,9 | ||
Feta cheese | 0 | 0 | – | ||
Trout | 0 | 0 | – | ||
Fruit tea (average) | – | – | – | ||
Grana Padano | 0 | 0 | – | ||
Pomegranate | 8,5 | 7,9 | 1,1 | ||
Grapefruit | 3,5 | 3,4 | 1 | ||
Large sapote | 9,7 | 10,1 | 1 | ||
Green beans | 1,7 | 1,2 | 1,4 | ||
Kale | 1,4 | 1,2 | 1,2 | ||
Guava | 3,7 | 2,2 | 1,7 | ||
Cucumber | 0,9 | 0,8 | 1,1 | ||
Oats | 0,4 | 0,4 | 1 | ||
Hazelnut | 1,6 | 1,6 | 1 | ||
Yeast | 0 | 0 | – | ||
Yeast extract | 0 | 0 | – | ||
Blueberry | 4,2 | 3,8 | 1,1 | ||
Herring | 0 | 0 | – | ||
Raspberry | 3,1 | 2,5 | 1,2 | ||
Millet (average) | 0,2 | 1,4 | 0,1 | ||
Honey | 40,2 | 35,2 | 1,1 | ||
Honeydew melon | 4,2 | 3,9 | 1,1 | ||
Chicken meat | 0 | 0 | – | ||
Cottage cheese | 0 | 0 | – | ||
Ginger | 4,5 | 4,5 | 1 | ||
Jackfruit | 9,4 | 9,7 | 1 | ||
Jalapeño peppers | 2,6 | 1,5 | 1,8 | ||
Japanese medlar | 4,6 | 4,8 | 1 | ||
Currant, red | 3,8 | 3,5 | 1,1 | ||
Blackcurrant, black | 3,3 | 3,3 | 1 | ||
Coffee | 0 | 0 | – | ||
Cocoa, pure | 1,1 | 1,1 | 1 | ||
Persimmon | 10 | 9 | 1,1 | ||
Prickly pear (average) – information ambiguous! | 4,6 | 5,6 | 0,8 | ||
Camel milk | 0 | 0 | – | ||
Potato (average) | 0,4 | 0,5 | 0,8 | ||
Chickpea | 0,1 | 0,1 | 1 | ||
Kiwi | 5,2 | 5,1 | 1 | ||
Garlic (small amounts tolerated in DE) | 4,9 | 3,8 | 1,3 | ||
Kohlrabi | 1,8 | 1,9 | 0,9 | ||
Coconut milk (average) | 1,5 | 1,7 | 0,9 | ||
Coconut, whole | 2,3 | 2,5 | 0,9 | ||
Korn / Clear schnapps | – | – | – | ||
Pumpkin (butternut) | 0,8 | 1,1 | 0,7 | ||
Pumpkin (average) | 1 | 0,8 | 1,3 | ||
Pumpkin (Hokkaido) | 1,4 | 1,6 | 0,9 | ||
Pumpkin (Hubbard) | 1,5 | 1,8 | 0,8 | ||
Pumpkin (spaghetti) | – | – | – | ||
Pumpkin seeds, dried | 0,7 | 0,7 | 1 | ||
Turmeric, ground | 1,6 | 1,6 | 1 | ||
Salmon | 0 | 0 | – | ||
Liver, beef | 0 | 0 | – | ||
Linseed | 0,6 | 1 | 0,6 | ||
Lima bean | 0,5 | 0,1 | 7,1 | ||
Limes | 1,1 | 1,1 | 1 | ||
Lenses | 1 | 0,7 | 1,4 | ||
Litchi | 7,7 | 9,3 | 0,8 | ||
Dandelion leaves | 0,8 | 1,5 | 0,5 | ||
Macadamia nut, raw | – | 2,3 | 0 | ||
Skimmed milk | 0 | 0 | – | ||
Skimmed milk powder | 0 | 0 | – | ||
Corn (can) | 2,9 | 3,1 | 0,9 | ||
Corn on the cob, cooked | 1,1 | 1,2 | 0,9 | ||
Malt beer (average) | 0 | 0 | – | ||
Tangerine | 5 | 4,7 | 1,1 | ||
Almonds, raw | 2,1 | 2,1 | 1 | ||
Mango | 8,2 | 5,5 | 1,5 | ||
Swiss chard | 0,4 | 0,3 | 1,2 | ||
Horseradish | 3,5 | 4,8 | 0,7 | ||
Milk, low-fat | 0 | 0 | – | ||
Poppy, seeds | 1,5 | 1,5 | 0,9 | ||
Carrot | 2,4 | 2,5 | 1 | ||
Whey | 0 | 0 | – | ||
Whey powder | 0 | 0 | – | ||
Mozzarella | 0 | 0 | – | ||
Natural yogurt md. 3.5% fat | 0 | 0 | – | ||
Nectarine | 3,8 | 3,9 | 1 | ||
Noodles (average) | 0,1 | 0,1 | 0,9 | ||
Fruit brandy, clear | 0 | 0 | – | ||
Okra, fresh | 0,9 | 0,6 | 1,4 | ||
Olives (pickled) | 0,3 | 0,3 | 1 | ||
Orange | 4,4 | 4,3 | 1 | ||
Oregano, fresh | 1,6 | 2,4 | 0,7 | ||
Papaya | 3 | 2,9 | 1 | ||
Paprika, yellow | 2,2 | 2,6 | 0,8 | ||
Paprika, green | 1,4 | 1,5 | 0,9 | ||
Paprika, red | 3 | 2,7 | 1,1 | ||
Parmesan cheese | 0 | 0 | – | ||
Parsnip | 1,5 | 1,5 | 1 | ||
Pecan, raw | – | 2 | 0 | ||
Parsley leaf | 2,4 | 2,7 | 0,9 | ||
Parsley root | 0,7 | 0,6 | 1,2 | ||
Pepper | 0,2 | 0,3 | 1 | ||
Horse milk | 0 | 0 | – | ||
Chanterelle, chanterelle | 0,1 | 0,1 | 0,7 | ||
Peach | 4 | 4,1 | 1 | ||
Plum | 3,9 | 5,2 | 0,7 | ||
Plum, dried | 12,5 | 25,5 | 0,5 | ||
Pistachios, raw | 3,7 | 3,8 | 1 | ||
Leek | 1,7 | 1,5 | 1,1 | ||
Cranberry | 3,1 | 2,1 | 1,5 | ||
Quinoa | 0,9 | 0,9 | 1 | ||
Quince | 4,9 | 3,2 | 1,5 | ||
Radish | 0,8 | 1,4 | 0,6 | ||
Rice, polished, white | 0,1 | 0,1 | 1,2 | ||
Rice milk, unsweetened | 2,2 | 2,2 | 1 | ||
Rhubarb | 0,7 | 0,7 | 0,9 | ||
Beef | 0 | 0 | – | ||
Rye flour (average) | 0,4 | 0,4 | 0,9 | ||
Raw ham | – | – | – | ||
Roquefor cheese | 0 | 0 | – | ||
Brussels sprouts | 1,2 | 1,2 | 1 | ||
Raisin | 31,6 | 31,2 | 1 | ||
Beet | 4,3 | 4,3 | 1 | ||
Red dragon fruit (red flesh) | 10,1 | 22,9 | 0,4 | ||
Red dragon fruit (white flesh) | 10,5 | 17,1 | 0,6 | ||
Red cabbage | 1,6 | 1,9 | 0,8 | ||
Red wine | 0 | 0 | – | ||
Rocket | 0,6 | 1,2 | 0,5 | ||
Cream (without additives) | 0 | 0 | 1 | ||
Salami (average) | 0 | 0 | – | ||
Salad | 0,6 | 0,5 | 1,2 | ||
Anchovies | 0 | 0 | – | ||
Sardines | 0 | 0 | – | ||
Sour cherry | 3,9 | 4,6 | 0,9 | ||
Sauerkraut | 0,2 | 0,4 | 0,5 | ||
Sour cream | 0 | 0 | – | ||
Sheep’s milk | 0 | 0 | – | ||
Black salsify | 0,9 | 0,8 | 1,1 | ||
Pork | 0 | 0 | – | ||
Sole | 0 | 0 | – | ||
Celery | 0,4 | 0,4 | 0,9 | ||
Soybean | 2,8 | 2,8 | 1 | ||
Soy milk, unsweetened (average) | 0,8 | 0,8 | 1 | ||
Sunflower, seed | 1,4 | 1,4 | 1 | ||
Sorghum millet (average) | 0,4 | 1,3 | 0,3 | ||
Asparagus | 1,1 | 0,9 | 1,2 | ||
Turnip | 1,8 | 2,3 | 0,8 | ||
Spinach | 0,2 | 0,2 | 1 | ||
Gooseberry | 4,2 | 3,9 | 1,1 | ||
Swede | 1,9 | 2,6 | 0,7 | ||
Porcini mushroom | 0,3 | 0,3 | 1 | ||
Star fruit | 1,7 | 2 | 0,9 | ||
Sweet potato | 2,3 | 2,4 | 0,9 | ||
Sweet cherry | 12 | 13 | 0,9 | ||
Teff | 0,8 | 1 | 0,8 | ||
Tomato (average) | 1,5 | 1,2 | 1,3 | ||
Quark (curd cheese) | 0 | 0 | – | ||
Grapes | 7,4 | 7,2 | 1 | ||
Turkey, meat | 0 | 0 | 1 | ||
Verjus (average) | 1 | – | – | ||
Vermicula, freshly caught | 3 | 3 | 1 | ||
Whole milk | 0 | 0 | – | ||
Whole milk powder | 0 | 0 | 0 | ||
Quail egg | – | – | – | ||
Watermelon | 4,1 | 2,2 | 1,9 | ||
Wine vinegar | 0 | 0 | – | ||
Grapes (red, green) | 8,2 | 7,3 | 1,1 | ||
White cabbage | 1,9 | 2,2 | 0,9 | ||
White wine | 0,4 | 0,4 | 1,1 | ||
Wheat, grain | 0,2 | 0,2 | 1,3 | ||
Wheat beer (average) | 0 | 0 | 0,5 | ||
Whisky | 0 | 0 | – | ||
Savoy cabbage | 1,8 | 2 | 0,9 | ||
Goat’s milk | 0 | 0 | – | ||
Cinnamon | 1,1 | 1,1 | 1,1 | ||
Lemon | 1,1 | 1,2 | 0,9 | ||
Zucchini | 1,2 | 1,1 | 1,1 | ||
Sugar melon | 3,2 | 2,6 | 1,2 | ||
Onion | 2,3 | 2,6 | 0,9 |
Fructose table: How to read this list correctly?
- The values in our fructose table are calculated from average values. As natural fluctuations can occur with most products, these values should only be seen as a rule of thumb.
- Values are only given if we have measured values. If no value is entered, this does not mean that the food is free of this substance! This is only the case if “0” is entered.
- The values are given in grams per 100 grams of food
- We indicate the total fructose content (and total glucose content). This always includes the free fructose and half the sucrose value.
- If the ratio of fructose to glucose (last column of the fructose table) is less than or equal to 1, the food tends to be better tolerated by people with fructose malabsorption.
- We have also included smileys in the left-hand columns for the recommended intake in the elimination diet (KP) and the permanent diet (DE) (see tolerability index)
For some products, no exact value can be assigned for various reasons. For example, the product can be available in countless varieties with different contents (e.g. red wine);
Other products show enormous variations in ingredients in the scientific literature. Therefore, no precise statements can be made. Location, degree of ripeness, cultivation, etc. play too great a role in the sugar production of the fruit. Here it is more useful to consult the community rating in the “Ask Ingrid” app.
Sources
+ nmi-Portal editorial team, nmidb.de / Own research work nmi-Portal / Zechmann, M.
+ Souci, S.W., Fachmann, W., Kraut, H.; Food Composition an Nutrition Tables; Wissenschaftliche verlagsgesellschaft; 2016
+ Herrmann, Karl; Ingredients of fruit and vegetables; Ulmer publishing house; 2001
+ Zechmann, M. “First aid after diagnosis – How to master the elimination diet”, 5th edition, Berenkamp Verlag, 2017